Many people ask, what's the best indicator? what indicators should I use? or what are the best indicators for day trading?
Indicators help us better understand what's going on in the market. They give us a better view on movements, trends, possibilities and value.
Indicators will give us more information through mathematical calculations
Don't be fooled to think that indicators are a magic solution, it takes a lot more than just using a couple of indicators to become a successful and smart trader. Trading is more than just applying a few trendlines on a chart.
As a trader you'll need to understand where the market is going, what's trending and in which direction. You need to be ready for any outcome, you can't predict the market fully but you have to understand the possibilities and to be positioned for the right one. It's also important not to trade emotionally!
Types of Indicators
For now we're going to discuss these 4 types of indicators, and in the future understand them into more depth.
- Trend
- Volume
- Volatility
- Momentum
A Trend indicator will help us understand in which direction the market might be moving.
A Volume
indicator will help us understand the trade volumes in the market. How much Bitcoin is being sold or bought and how big that move was.
A Volatility indicator is very important for crypto traders. It tells us how much the price has change at a given time. Many stock and commodity traders had moved to crypto because of it's volatility.
A Momentum indicator will let us know how strong the trend is and if the trend might change.
It gives us important information on wether a reversal might happen, if the asset is overbought or oversold.
The 4 Indicators
1. RSI
RSI or Relative Strength Index is a momentum indicator. There's a range of 0 to 100, between those ranges there's a line that shows the past and current RSI.
What does the range mean?
The range helps us identify if the market is overbought or oversold.
An indication over 70 represents an overbought market, suggesting a top.
An indication under 30 represents an oversold market, suggesting a bottom.
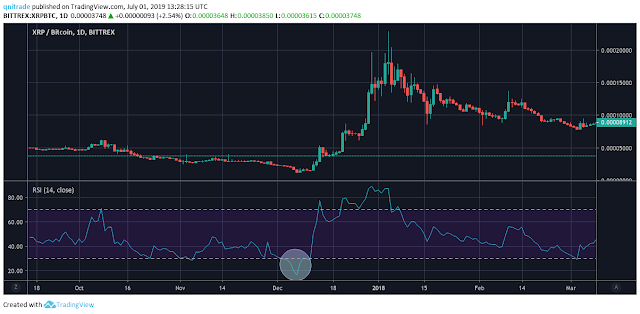
In this chart we can see XRPUSD going into the oversold zone
and after that indication, a change in the direction of the market.
Say you had bought XRPUSD when the RSI was around that bottom. If you
had waited for the RSI to move back to the 50's-70's range you would've
made a new profit.
RSI is also good for a shorting scenario.
After that XRPUSD had reached well above the 70 RSI
range. This could've been a good time for shorting as we can see in the
chart, when it reach that point, the direction of the market changed and
a correction came. The RSI indicator helped us identify the top and
avoid buying the it, and instead, short it.
2. Bollinger Bands
Bollinger Bands is a volatility indicator. It is drawn on your charts with 3 lines. An upper line, a bottom line and a moving average in the middle.
The upper and bottom lines make up the bands.
It is pretty simple to use and can prove really useful in identifying the volatility of a certain asset.
When the bands are narrow, we can say that the market is not so volatile and is relatively calm.
When the bands open up and become wider, we can say that the market is becoming volatile.
There are a couple of scenarios we need to consider when using Bollinger Bands.
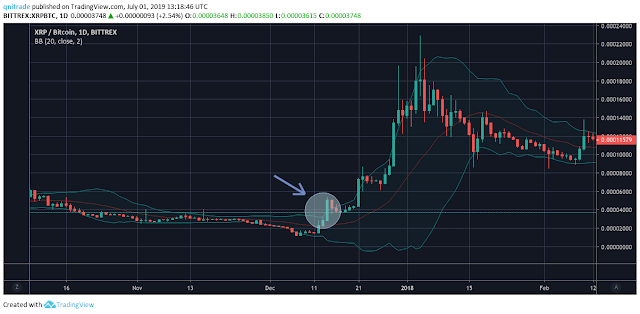
In this chart we can see that the bands are narrow and the market doesn't have big movements.
On the other hand, we can see that on this chart the bands are
opening up, a good indication of an uptrend is when a candlestick is
touching the top of the band without touching the moving average in the
middle of it. As we can see when that indication came true, the market
continued going up untill the bands became narrow.
While on this chart, the bands also opened up but in a different direction,
we can see that a red candlestick is touching the bottom of the band
and not touching the moving average, that gives us an indication that
it's going to go down.
And it does.
3. Moving Averages
Moving Average (or MA) is a trend indicator create a single flowing line from price data. It represents the the average price of an asset over a given period of time. You can choose any time frame for your moving averages, depending on the time frame you trade on.
A popular choice is using 200-day and 50-day MAs for long term and 12-day and 26-day MAs for short term.
We can learn a few things from Moving Averages. If a Moving Average is moving horizontally over a period of time, it means the price is not trending, it's ranging. If the line is heading down, a downtrend is underway. What if the line is heading up? Right, an uptrend is going on. Simple and easy!
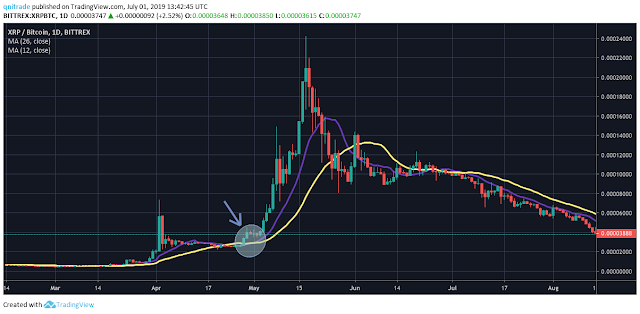
So another way we can use MAs in is crossovers. By using both a 12-day and a 26-day MA on your chart, you can get buy and sell signals.
A buy signal occurs when the 12-day MA is crossing above the 26-day MA.
A sell signal occurs when the 26-day MA is cross above the 12-day MA.
We can also get a signal to buy or sell depending if the MA is above or below the price, if the MA is below the price, it could indicate a buy signal and an uptrend. If the MA is above the price, it could indicate a sell signal and a downtrend. Tho' it is not recommended to use MAs like that because of the volatility.
4. Volume
Volume measures how much of an asset has been traded in at a given time.
This tool is often overlooked by many traders and is often not used.
Volume allows us to know how much was sold or about under a certain time frame, that allows us to see what's the market interest.
A trending market will see rise in volume along with the price.
If the price is getting higher but the volume is getting lower, that could indicate a lower interest in the market. A price that's getting higher or lower along with lower volume doesn't give us much of an indication. But a price that's getting higher or lower along with higher volume is a good indication that something is changing.
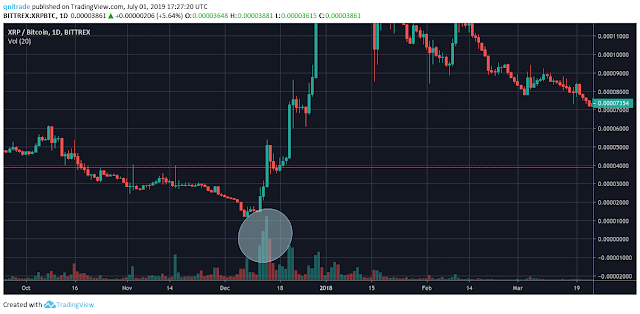
We can see a huge increase in the volume along with the price, which could give us an indication that there's an uptrend and a rise in interest.
Red volume bars will indicate a rising sell volume, that along with a lowering price could tell us about a possible downtrend.
Conclusions
Don't put your full trust into indicators alone. People trade using many different methods, be it indicators, the chart alone, consumer psychology and more. Choose whatever you feel works and that has worked for you. If you're a new trader, it's always good to keep trying until you find the winning setup that's good for you.
Risk management is one of the most important things you have to account for.
We will talk about handling risk management in the future.
I hope this will prove useful to some people and will help better understand the tools that are available when trading.
Just for the sake of it,
This is not a financial advice, trade at your own risk!


Comments
Post a Comment